With the Federal election now confirmed for July 2 it is natural to wonder what the implications for investment markets and the economy might be. At present opinion polls give the Coalition a slight lead over Labor but it’s very close at around 51%/49%. That said according to bets placed on online betting agencies the Coalition is the favourite at around 72% probability of victory, albeit this is down from around 87% earlier this year.
Elections, the economy & markets in the short term
There is anecdotal evidence that uncertainty around elections causes households and businesses to put some spending decisions on hold – the longer the campaign the greater the risk. This campaign is eight weeks and arguably longer given the change in budget timing announced in March to make way for a July 2 election. Qantas has already suggested that election uncertainty may be affecting spending. However, hard evidence regarding the impact of elections on economic indicators is mixed and there is no clear evidence that election uncertainty effects economic growth in election years as a whole. Since 1980 economic growth through election years averaged 3.7% which is greater than average growth of 3.2% over the period as a whole. That said growth was below average at 2.3% in 2013 which also saw a long de facto election campaign.
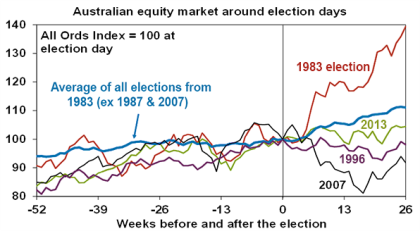
In terms of the share market, there is some evidence of it tracking sideways in the run up to elections, which may be because investors don’t like the uncertainty associated with the prospect of a change in economic policies. The next chart shows Australian share prices from one year prior to six months after federal elections since 1983. This is shown as an average for all elections (but excludes the 1987 and 2007 elections given the global share crash in late 1987 and the start of the global financial crisis in 2007), and the periods around the 1983 and 2007 elections, which saw a change of government to Labor, and the 1996 and 2013 elections, which saw a change of government to the Coalition. The chart suggests some evidence of a period of flat lining in the run up to elections, possibly reflecting investor uncertainty beforehand, followed by a relief rally soon after.

Source: Thomson Reuters, AMP Capital
However, the elections resulting in a change of government have seen a mixed picture. Shares rose sharply after the 1983 Labor victory but fell sharply after the 2007 Labor win, with global developments playing a role in both. After the 1996 and 2013 Coalition victories shares were flat to down. So based on historical experience it’s not obvious that a victory by any one party is best for shares in the short term and historically the impact of swings in global shares arguably played a bigger role than the outcomes of Federal elections.
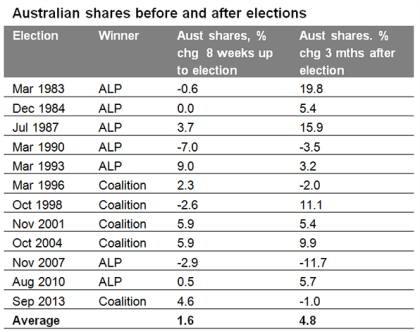
The next table shows that 8 out of 12 elections since 1983 saw shares up 3 months later with an average gain of 4.8%.

Based on All Ords index. Source: Bloomberg, AMP Capital
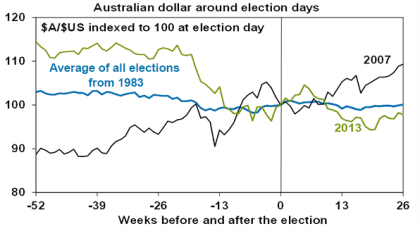
The next chart shows the same analysis for the Australian dollar. In the six months prior to Federal elections there is some evidence the $A experiences a period of softness and choppiness which is consistent with policy uncertainty, but the magnitude of change is small. On average, the $A has drifted sideways to down slightly after elections.

Source: Thomson Reuters, AMP Capital
Australian bond yields have tended to fall over the six months prior to Federal elections since 1983, which is contrary to what one might expect if there was investor uncertainty. However, this may be related to the aftermath of recessions, slowdowns and/or falling inflation prior to the 1983, 1984, 1987, 1990 and 1993 elections and the secular decline in bond yields since the 1980s. Overall, it’s hard to discern any reliable effect on bond yields from federal elections themselves.
Political parties and shares
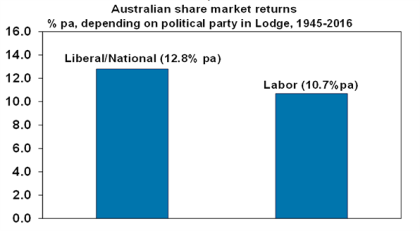
Over the post-war period shares have returned 12.8% pa under Coalition Governments & 10.7% pa under Labor Governments.

Source: Thomson Reuters, AMP Capital
It may be argued that the Labor governments led by Whitlam in the 1970s and Rudd and Gillard more recently had the misfortune of severe global bear markets and, if these periods are excluded, the Labor average rises to 15.8% pa. Then again that may be pushing things a bit too far. But certainly the Hawke/Keating government defied conventional perceptions that conservative governments are always better for shares. Over the Hawke/Keating period from 1983 to 1996 Australian shares returned 17.3% pa, the strongest pace for any post-war Australian government.
Once in government, political parties are usually forced to adopt sensible macro-economic policies if they wish to ensure rising living standards and arguably there has been broad consensus on both sides of politics regarding key macro-economic fundamentals – eg, low inflation and free markets.
Policy differences starker than since the 1970s
However, this time the policy differences between the Coalition and Labor are arguably starker than they have been since the 1993 election (when the Coalition proposed an even more significant reform of the economy than Hawke and Keating had been pursuing) or arguably since the 1970s (when there used to be more of a focus around “class warfare”). And so the economic uncertainty around this election may be greater than usual. While the focus on reducing the budget deficit is still there, it has softened, with each side of politics now offering very different visions for the size of government:
-
Labor is focussed on spending more on health and education and in the process allowing the size of the public sector to increase, funded by tax increases on higher income earners (retention of the budget deficit levy, cutbacks in access to negative gearing, the capital gains tax discount and superannuation). Intervention in the economy is likely to be higher than under a Coalition government.
-
By contrast the Coalition is focussed more on containing spending, and encouraging economic growth via company tax cuts and mild reforms. Despite the Coalition’s tilt to “fairness” with its super reforms it’s committed to keeping taxes down.
The left right divergence between Labor and the Coalition was narrowed in recent decades by the reform oriented rationalist approach kicked off by Hawke and Keating in the 1980s in response to the economic failures of the 1970s. It now seems to have widened again with populist focus on issues of fairness after the 2014 Federal Budget debate and an electorate less averse to tax hikes. It’s also consistent with rising interest in populist policies in the US – as evident by the success of Sanders and Trump – which in turn reflects angst over job losses from globalisation & automation and widening inequality.
Perceptions that a more left leaning Labor Government will mean bigger government, more regulation and higher taxes and hence be less business friendly may contribute to more volatility in shares and the $A around the election. This may be partly offset by a firm commitment from Labor to bring the deficit under control (although both sides of politics have been saying that for years now). More broadly there are a number of risks in all this:
-
The focus on economic reform needed to boost productivity seems to be falling by the wayside in the face of populism – eg, why aren’t we considering injecting more competition into the health sector rather than just spending more on it?
-
There is a danger in relying on tax hikes on the rich (whether retention of the budget levy or cutting access to concessions) in that Australia’s top marginal tax rate of 49% is already high – particularly compared to our neighbours: 33% in NZ; 20% in Singapore; and 15% in HK. Australia’s income tax system is already highly progressive: 1% of taxpayers pay 17% of tax (with an average tax rate of 42%) and the top 10% pay 45% of tax compared to the bottom 50% who pay just 12% (with an average tax rate of 11%).
-
While talk of a budget emergency in 2013 was over the top, the seeming relegation to second order of budget repair under each successive government is risky. The loss of our AAA rating would risk alienating foreign investors on whom we depend.
-
While the Coalition is still banking on winding back growth in welfare spending, this still won’t be realised if the Senate doesn’t become friendlier – the track record of double dissolution elections is not good in this regard. Don’t forget that it was hoped that the last election would end minority government but in reality it didn’t.
In short, the widening left right divide in Australian politics suggests greater uncertainty going into this election potentially affecting all asset Australian classes, including residential property. But the bigger concern is the seeming dwindling prospects for productivity enhancing economic reform, which could be an ongoing dampener on growth in living standards.
Source: AMP Capital
About the Author
Dr Shane Oliver, Head of Investment Strategy and Economics and Chief Economist at AMP Capital is responsible for AMP Capital’s diversified investment funds. He also provides economic forecasts and analysis of key variables and issues affecting, or likely to affect, all asset markets.
Important note: While every care has been taken in the preparation of this article, AMP Capital Investors Limited (ABN 59 001 777 591, AFSL 232497) and AMP Capital Funds Management Limited (ABN 15 159 557 721, AFSL 426455) makes no representations or warranties as to the accuracy or completeness of any statement in it including, without limitation, any forecasts. Past performance is not a reliable indicator of future performance. This article has been prepared for the purpose of providing general information, without taking account of any particular investor’s objectives, financial situation or needs. An investor should, before making any investment decisions, consider the appropriateness of the information in this article, and seek professional advice, having regard to the investor’s objectives, financial situation and needs. This article is solely for the use of the party to whom it is provided.


