Bridging troubled waters: the pros of investing in infrastructure
Global markets are yet to enter any serious downturns. Still, fragile growth outlooks, high levels of market volatility, record-low interest rates and myriad geopolitical and macroeconomic risks – not least of which is a trade war between the world’s two largest economies – will leave many wondering how they will meet their investment goals in the short to medium term.
The current investment environment is no doubt an uneasy one for many investors. Rather than wait for economic winds to change, investors could instead look to investment classes with outlooks that are less dependent on external and cyclical factors as some others. In this regard, infrastructure investment offers some compelling features in an uncertain climate.

What are some of the benefits of investing in infrastructure?
1. Consistent returns with lower volatility1 through market cycles
Infrastructure assets are commonly “essential services” assets. This means people have to use them on a day-in and day-out basis. As a result, both utilisation and returns can often be less dependent on the prevailing economic climate than other investments. It is very hard for someone to get through a day without having to use some form (or forms) of essential infrastructure such as electricity, water, gas, schools, hospitals, roads, rail and airports.
In addition, infrastructure assets often benefit from significant barriers to entry in the markets in which they operate. They can have contractual protection from competition by government, while high costs and long lead times for construction provide natural monopolies, and give advance warning and further insurance against new competitive threats to existing revenue streams.
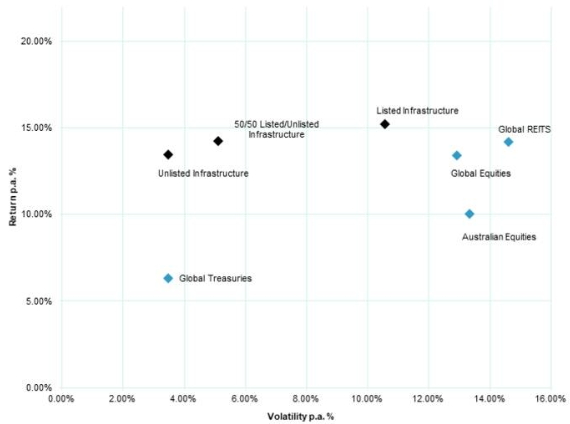
For this reason, returns are often more reliable than those associated with comparable assets outside the sector. Figure 1, below, compares the performance and volatility of infrastructure in various forms, with a range of other asset classes being Australian equities, global equities, global bonds, and global real estate investment trusts (Global REITs). It demonstrates that that over the last 10 years, on an annualised basis, and relative to other asset classes with comparable performance, returns on infrastructure have been delivered with much lower levels of volatility.
Figure 1: Return and volatility of selected asset classes, 10 years to 30 June 2019.3

Past performance is not a reliable indicator of future performance.
2. Reliable long-term income yields
Infrastructure asset revenues are often underpinned by regulation or long-term contracts, which provide a high level of visibility of, and certainty around, future cashflows from the asset.
The most obvious example of this in practice occurs with Public Private Partnerships or ‘PPPs’ which are often used by governments to deliver infrastructure projects such as roads, hospitals, schools and public transport systems.
Concessions for assets such as these are often granted over lengthy contractual periods (which can be 30 years or more) and typically offer ‘availability’ revenues, which are paid on the basis that the asset is made available and maintained in a fit state for the intended use, irrespective of the extent to which it is actually used.
For example, in the case of a school of this type, so long as the asset is maintained in a fit state and made available for use, the asset owner gets paid a fixed amount irrespective of the number of students that are enrolled in the school.
Isolation from usage risk in this manner provides a unique level of visibility and security of future revenues from the asset, particularly given that the counterparty responsible for making the availability payments is often a highly creditworthy government body. In addition, infrastructure asset revenues are often linked to inflation, which can help investors protect against the erosion of the value of their investment by inflation over time.
3. Diversification and reduced overall portfolio risk
Overall portfolio diversification is improved when assets have a low level of correlation2 – that is, where assets don’t behave the same way at the same time. The infrastructure asset class, and unlisted infrastructure in particular, has historically demonstrated low levels of correlation with other asset classes, meaning its inclusion in a broader portfolio can be an effective means of reducing overall portfolio risk.
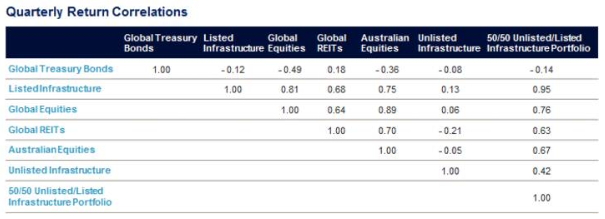
This is illustrated in Figure 2, below, which compares the correlation of various forms of infrastructure investment with a range of other asset classes being Australian equities, global equities, global bonds, and global real estate investment trusts (REITs).
As can be seen, most listed indices are highly correlated with one another, suggesting that even portfolios that were spread across a number of listed asset classes would be poorly diversified. Bonds are negatively correlated with other asset classes, and represent an effective option for diversification, albeit one which traditionally has offered lower long-term returns (see Figure 1.)
Infrastructure, and particularly unlisted infrastructure, displays low correlation with many other asset classes, making it another option for investors wishing to diversify their portfolio, and an attractive one given the historically strong returns illustrated in Figure 1.
Figure 2: Quarterly return correlations for selected asset classes, 10 years to 30 June 2019.3

Past performance is not a reliable indicator of future performance.
Conclusion
Many investors have cottoned on to the benefits of infrastructure, and we expect this to heighten. There is a significant need for new infrastructure in both developed and developing economies. With governments across the globe burdened with high levels of debt, fewer infrastructure projects are likely to be publicly funded. The need for private capital to replace ageing infrastructure or fund new projects will consequently persist over the long term, which we believe will support a broad and growing range of infrastructure investment opportunities.
Author: John Julian, Investment Director – Infrastructure Equity, Sydney, Australia
Source: AMP Capital 10 Oct 2019
1 Volatility is a means of measuring investment risk. It is a probability measure of the standard deviation of expected returns, and hence can provide a useful comparative measure of the relative risk of different investments over a particular time period.
2 Correlation is another comparative statistical measure. It shows how asset valuations move relative to each other. For example, if assets have a correlation of 1, their values move exactly together. Hence, the addition of assets with a correlation of 1 to a portfolio would provide no diversification benefit. If the correlation was -1, the valuations would move exactly opposite to each other, providing great diversification benefits by lowering the volatility of the portfolio. Interestingly, Figure 1 shows that the volatility of a portfolio of 50% listed and 50% unlisted infrastructure is much lower (~5.5%) than would be expected by simply averaging the volatility of each (~7%). This is because of the low correlation of unlisted infrastructure to listed infrastructure as can be seen in Figure 2 (0.13).
3 Notes to charts:
The charts compare the returns, volatility and correlation of a range of asset classes represented by the indices specified below. Different asset classes will offer different investment features, including differing levels of liquidity.
Unlisted Infrastructure represented by the MSCI Australian Unlisted Infrastructure Index. Listed Infrastructure represented by the Dow Jones Brookfield Global Infrastructure Net Accumulation Index. Global Treasury Bonds represented by Bloomberg Barclays Global Treasury GDP Index. Global Equities represented by the MSCI World Net Accumulation Index. Global REITS represented by the FTSE EPRA NAREIT Developed Rental Net. Australian Equities represented by the S&P/ASX 200 (franking credit adjusted). 50/50 Unlisted/Listed Infrastructure Portfolio represented by a 50% weighting to the MSCI Australian Unlisted Infrastructure Index, and a 50% weighting to the Dow Jones Brookfield Global Infrastructure Net Accumulation Index. All data in AUD. All data is for the period 31 March 2009 to 30 June 2019, except for the FTSE EPRA NAREIT Developed Rental Net index where data is for the period 31 May 2009 to 30 June 2019 (as the data series only began in May 2009).
Important notes: While every care has been taken in the preparation of this article, AMP Capital Investors Limited (ABN 59 001 777 591, AFSL 232497) and AMP Capital Funds Management Limited (ABN 15 159 557 721, AFSL 426455) (AMP Capital) makes no representations or warranties as to the accuracy or completeness of any statement in it including, without limitation, any forecasts. Past performance is not a reliable indicator of future performance. This article has been prepared for the purpose of providing general information, without taking account of any particular investor’s objectives, financial situation or needs. An investor should, before making any investment decisions, consider the appropriateness of the information in this article, and seek professional advice, having regard to the investor’s objectives, financial situation and needs. This article is solely for the use of the party to whom it is provided and must not be provided to any other person or entity without the express written consent of AMP Capital.


