
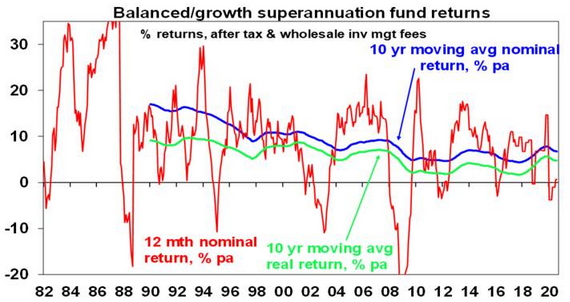
Despite a 35% or so plunge in share markets earlier this year; on the back of the pandemic and rough patches in 2018, 2015 and 2011, well diversified Australian investors have seen pretty good returns over the last 10 years. The median balanced growth superannuation fund returned 5.8% pa over the five years to August and 7.3% pa over 10 years and that’s after fees and taxes. While that’s dull compared to the double digit returns of the higher inflation world of the 1980s and 1990s, it’s pretty good once low inflation of 2% pa or less is allowed for.
Source: Mercer Investment Consulting, Morningstar, AMP Capital
However, investors need to allow that past returns have been boosted by a search for yield as interest rates have collapsed, which has pushed down yields and pushed up values for most assets. But this in turn points to eventually constrained returns.
Investing 101: lower yields = lower return potential
It’s pretty obvious that investment returns have two components: yield (or income flow) and capital growth. Also, the price of an asset moves inversely to its yield all other things being equal. For example, suppose an asset pays $10 a year in income and its price is $100 – this means an income flow or yield of 10%. If interest rates on bank term deposits are cut this will likely encourage increased investor interest in the asset as investors will like its high yield. Its price will then be pushed up – to say $120, which given the $10 annual income flow means that its yield will have fallen to 8.3% (i.e. $10 divided by $120). This is great for investors who were already in the asset as its value has gone up by 20%. But its yield is now pointing to lower potential returns going forward, unless the yield continues to fall, further boosting capital growth – but there is a limit to this.
The plunge in yields since the early 1980s
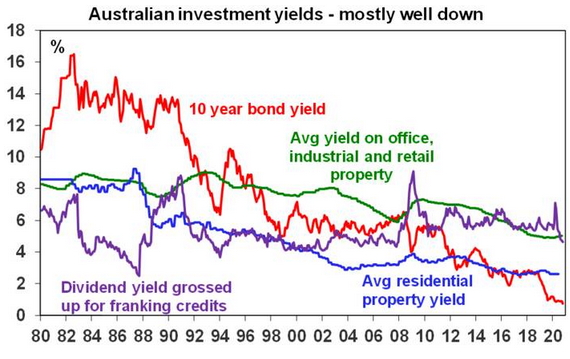
In the early 1980s, the RBA’s “cash rate” was around 14%, 1-year term deposit rates were nearly 14%, 10-year bond yields were around 13.5%, commercial and residential property yields were around 8-9% and dividend yields on shares were around 6.5% in Australia and 5% globally. This meant investments were already providing very high income so only modest capital growth was needed for growth assets to generate good returns. So, most assets had very strong returns and balanced growth; super fund returns averaged 14.1% in nominal terms and 9.4% in real terms between 1982 and 1999 (after taxes and fees).
But with the shift from very high inflation to very low inflation, the last 40 years has seen a collapse in yields. This was led by falling interest rates and bond yields and then yields on other assets were pushed down too as investors searched out higher yields which pushed their prices up and their yields down. Just as the GFC gave this a push along so has the coronavirus pandemic’s hit to the global economy. See the next chart.
Source: Bloomberg, REIA, JLL, AMP Capital
Today the cash rate is 0.25% (and likely to fall to 0.1% next month), 1-year bank term deposit rates are 0.75%, 10-year bond yields are 0.75%, gross residential property yields are around 3%, commercial property yields are around 5%, dividend yields are around 4.5% for Australian shares (with franking credits) but they are 2.25% for global shares. This points to a lower return potential for a diversified mix of assets.
More constrained capital growth
What’s more, the capital growth potential from growth assets is likely to be constrained relative to the past, reflecting a number of megatrends, some of which have been reinforced by the coronavirus pandemic:
-
An increasing reluctance by households to take on more debt.
-
An ongoing retreat from globalisation, deregulation and small government in favour of populist, less market friendly policies.
-
Rising geopolitical tensions – notably as the US attempts to constrain the rising power of China.
-
Aging populations and slowing population growth – resulting in slowing labour force growth.
-
Growing online retail sales and “work from home” will impact retail and office property space demand but I suspect this will see spending diverted to show up elsewhere in the economy.
Of course, continuing technological innovation and automation as well as rapid growth in Asia and China’s middle class will likely work to boost growth. But the net impact is likely to be more constrained global economic growth.
Medium-term (ie, 5 to 10 year) return projections
Our approach to get a handle on medium-term return potential of major asset classes is to start with current yields for each and apply simple and consistent assumptions regarding capital growth allowing for the above-mentioned megatrends. We also prefer to avoid forecasting and like to keep the analysis simple.
-
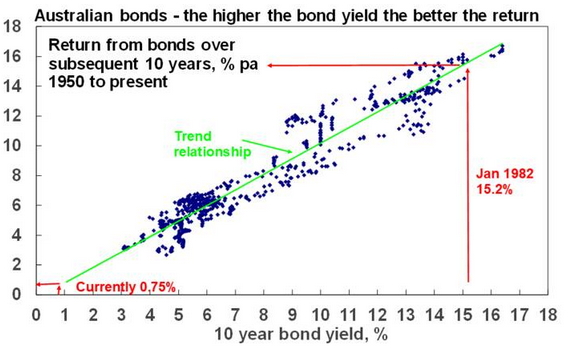
For bonds, the best predictor of future medium-term returns is current bond yields – as can be seen historically in the next chart. If a 10-year bond is held to maturity its initial yield (0.75% right now in Australia) will be its return over 10 years. We use 5-year bond yields as they more closely match the maturity of bond indexes.
Source: Global Financial Data, Bloomberg, AMP Capital
-
For equities, current dividend yields plus trend nominal GDP growth (a proxy for capital growth) does a good job of predicting medium-term returns1.
-
For property, we use current rental yields and likely trend inflation as a proxy for rental and capital growth. The surge in online spending and “work from home” means greater than normal uncertainty around these returns at present.
-
For unlisted infrastructure, we use current average yields and capital growth just ahead of inflation.
-
In the case of cash, the current rate is of no value in assessing its medium-term return. So, we allow for some rise in cash rates after 2023.
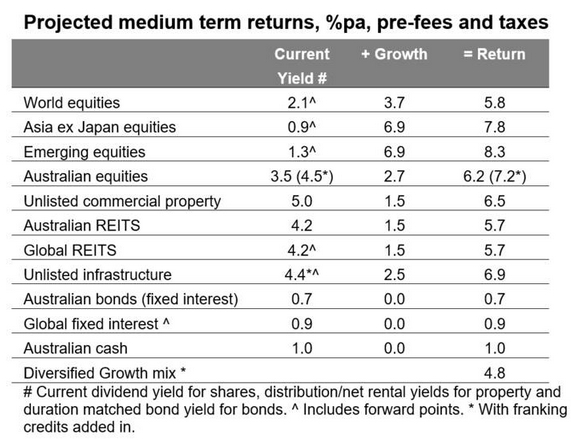
Our latest return projections are shown in the next table. The second column shows each asset’s current income yield, the third shows their 5-10 year growth potential, and the final column their total return potential. Note that:
-
We assume inflation averages around 1.5% p.a.
-
For Australia we have adopted a relatively conservative growth assumption reflecting slower productivity growth.
Source: AMP Capital
Key observations
Several things are worth noting from these projections.
-
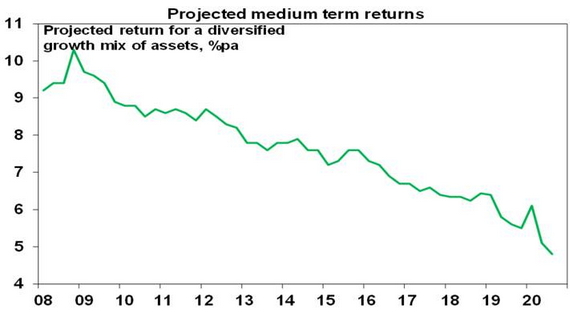
The medium-term return potential has continued to fall due falling yields and reduced capital growth prospects. For a diversified growth mix of assets, it has fallen from 10.3% pa in March 2009 and 5.6% a year ago, to now just 4.8%.
Source: AMP Capital
-
While past bond returns have been ok as yields fell pushing up bond prices, ultra-low yields now point to low returns.
-
Commercial property and infrastructure come out relatively well, but face greater than normal uncertainty in the demand for retail and office space & human transport infrastructure.
-
Australian shares stack up well on the basis of yield, but it’s still hard to beat Asian/emerging shares for growth potential.
-
The downside risks to our medium-term projections are that economies stay in recession longer driving another plunge in shares or that yields are pushed up to more normal levels as inflation rebounds causing large capital losses.
-
The upside risks are less obvious but could occur if we see improving global growth but inflation remaining very low.
Implications for investors
-
First, have reasonable return expectations. With low yields, low inflation and constrained growth it’s unreasonable to expect sustained double-digit or high single digit returns.
-
Second, remember that allocating more to growth assets to boost overall returns does mean taking on more risk.
-
Third, bear markets are painful and are hard to predict, but they do push up the medium-term return potential of shares and so provide opportunities for investors.
-
Fourth, some of the decline in return potential reflects very low inflation – real returns haven’t fallen as much – and 4.8% pa is still well above sub 1% bank term deposit rates.
-
Finally, focus on assets with decent sustainable income flow as they provide confidence regarding future returns.
1 Adjustments can be made for: dividend payout ratios (but history shows retained earnings often don’t lead to higher returns so the dividend yield is the best guide); the potential for PEs to move to some equilibrium level (but forecasting the equilibrium PE can be difficult and dividend yields send valuation signals anyway); and adjusting the capital growth assumption for some assessment regarding profit margins (but this is hard to get right). So, we avoid forecasting these things.
Source: AMP Capital 21 October 2020
Important notes: While every care has been taken in the preparation of this article, AMP Capital Investors Limited (ABN 59 001 777 591, AFSL 232497) and AMP Capital Funds Management Limited (ABN 15 159 557 721, AFSL 426455) (AMP Capital) makes no representations or warranties as to the accuracy or completeness of any statement in it including, without limitation, any forecasts. Past performance is not a reliable indicator of future performance. This article has been prepared for the purpose of providing general information, without taking account of any particular investor’s objectives, financial situation or needs. An investor should, before making any investment decisions, consider the appropriateness of the information in this article, and seek professional advice, having regard to the investor’s objectives, financial situation and needs. This article is solely for the use of the party to whom it is provided and must not be provided to any other person or entity without the express written consent of AMP Capital.


