Introduction
After pushing to record highs, share markets had a sizeable correction into last week – with US and global shares down nearly 9% and Australian shares down nearly 6%. Such volatility is not unusual and is the price we pay for the higher longer term returns shares provide over defensive assets like cash and bonds. However, it’s clear the source of global volatility & investor concern is now switching from worries about inflation back to growth. This note looks at seven key charts worth keeping an eye on.
Chart 1 (and 1b) – inflation
A global interest rate easing cycle is underway. It kicked off in the emerging world and spread to developed countries starting with Switzerland and Sweden and more recently Canada, the ECB and the UK. The US is likely to join in September with Australia likely to follow early next year. So far this has been driven by falls in inflation which has allowed central banks to become less restrictive. Obviously, inflation needs to continue its path to central bank targets and so still needs to be monitored. In this regard, our US Pipeline Inflation Indicator continues to point to lower inflation ahead. While US unemployment has spiked, so far other US economic indicators are mixed so an emergency inter-meeting or 0.5% cut is unlikely unless economic data or share markets fall sharply.
AMP Pipeline Inflation Indicator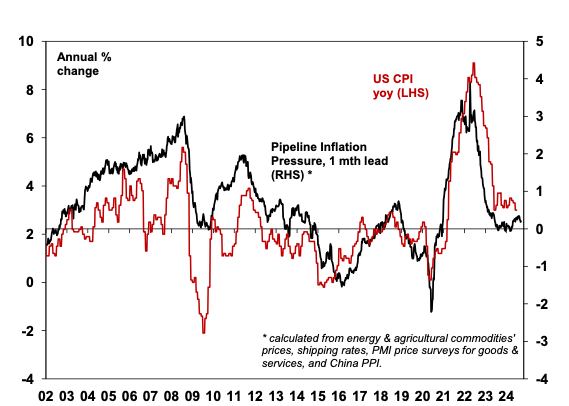
Source: Bloomberg, AMP
Australian inflation is lagging the US by 3-6 months, including in terms of the recent pause in the fall in inflation. Our Australian Pipeline Inflation Indicator continues to point down though. As a result, we remain of the view that the next move by the RBA is a cut although absent an economic and/or financial shock the RBA is unlikely to be “sufficiently confident that inflation is moving sustainably towards the target” until around February next year when we expect the first rate cut.
Australia Pipeline Inflation Indicator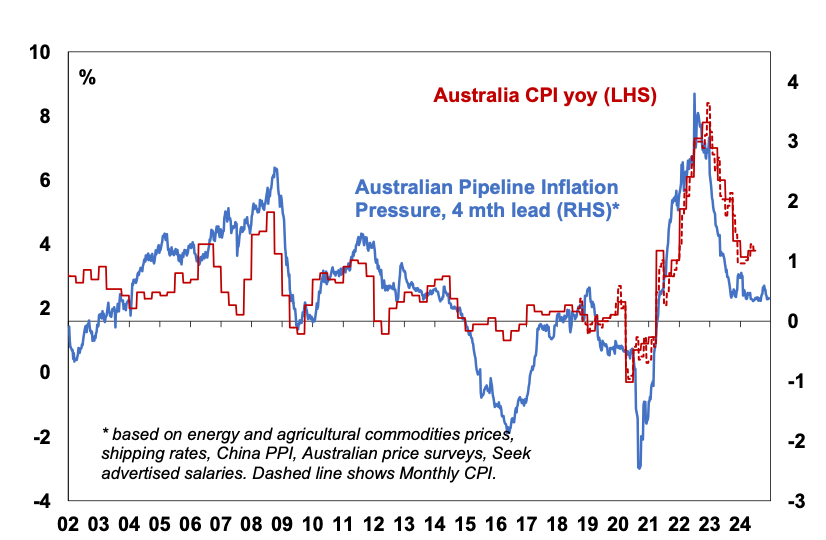
Source: Bloomberg, AMP
Chart 2 – longer term inflation expectations
The 1970s tells us the longer inflation stays high, the more businesses, workers and consumers expect it to stay high and then they behave in ways which perpetuate it. The good news is that short term inflation expectations have fallen sharply, and longer-term inflation expectations remain low as measured in the US by the University of Michigan. In Australia the RBA assesses that they have increased but only to around 2.5%. This is very different from 1980 when US inflation expectations were around 10% and deep recession was required to get inflation back down.
US University of Michigan Consumer Inflation Expectations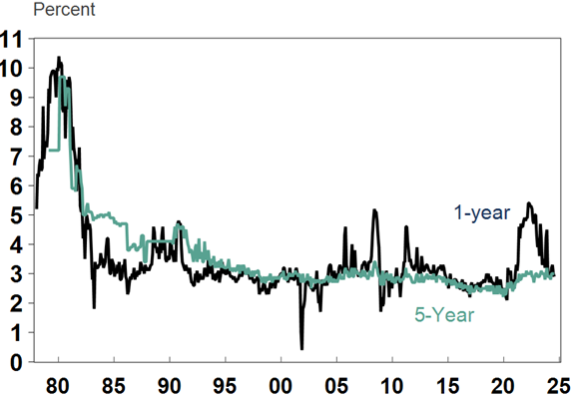
Source: Macrobond, AMP
Chart 3 – global business conditions PMIs
A key driver of how shares perform over the next 6-12 months will be whether major economies including Australia slide into recession and, if so, how deep it is. Key forward looking indicators – like the US yield curve and Leading Index and consumer confidence in Australia – suggest the risk is high reflecting rate hikes since 2022. Some good news though is that any recession may be mild as we have not seen the sort of spending excesses that often precede deep recessions. Global business conditions indexes (PMIs) – which are surveys of purchasing managers at businesses – will be a key warning indicator. Right now, they are soft but at levels consistent with okay growth, although weakness in manufacturing is a concern.
Global Composite PMI vs World GDP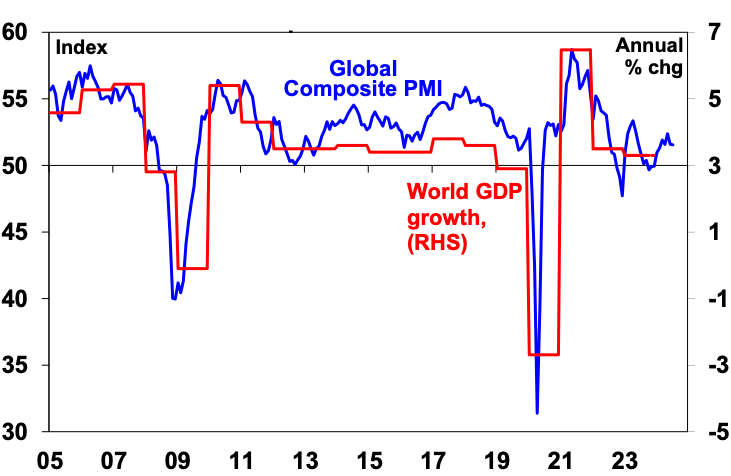
Source: Bloomberg, AMP
Chart 4 – unemployment and underemployment
Jobs markets have been cooling leading to falling wages growth which is good news for rate cuts. The bad news is that if unemployment and underemployment rise too rapidly it can become self-perpetuating for a while as it leads to job insecurity, which leads to less spending, which leads to more job losses, etc. This has been particularly the case in the US over many decades and explains recent concern about the further rise in unemployment. Of course, the recent spike in US unemployment could reverse and it’s been more due to more workers rather than permanent layoffs which makes it different to past cycles so far. And in Australia it remains low by the standards of recent decades. But the trend in both countries is up and forward-looking indicators – like hiring plans and job ads – point to a further rise.
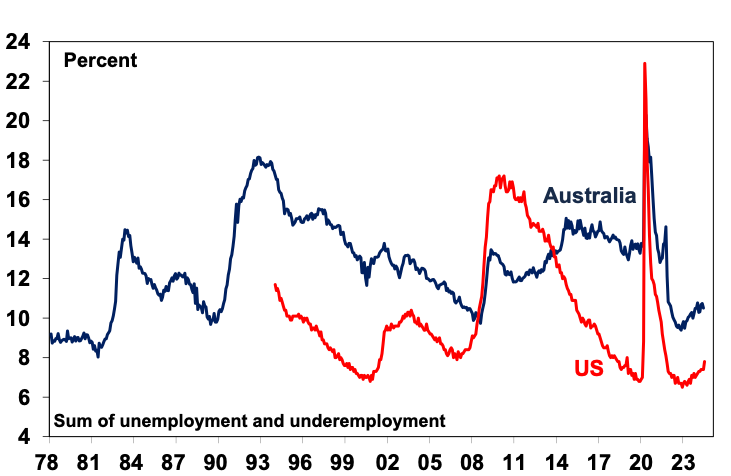
Source: Bloomberg, AMP
Chart 5 – company profits
Consensus US and global earnings growth expectations for the next 12 months are around 13%, and in Australia they are around 5%. This would be at risk if we slide into recession. US June quarter earnings results for tech and consumer discretionary companies were more mixed but so far so good with profits up 11% on a year ago. In Australia, its early days in the June half reporting season which is a bit make or break given expectations of a return to growth after two financial years of falls. Ideally, we need to see more companies reporting increases in dividends from a year ago as this would be a sign of corporate confidence in the sales and profit outlook.
ASX 200 Companies Reporting…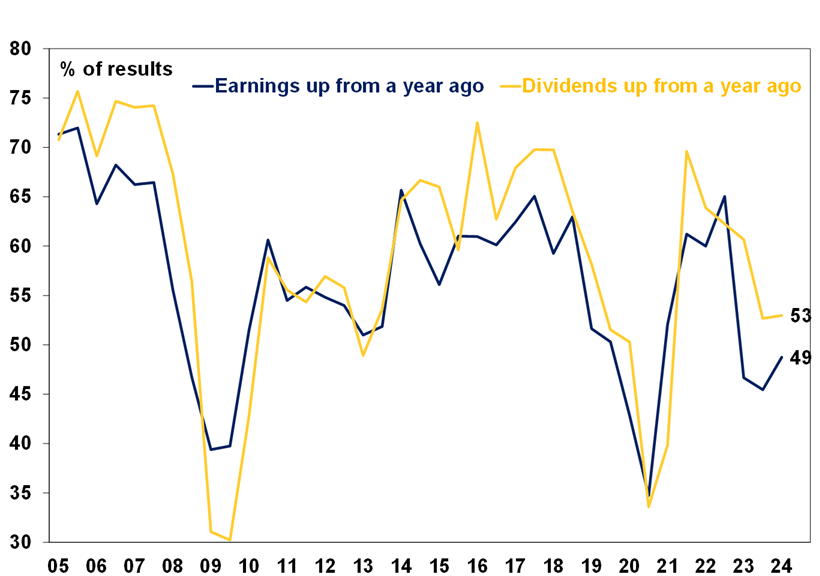
Source: Bloomberg, AMP
Chart 6 – the gap between earnings and bond yields
Since 2020 lows, rising bond yields and rising price to earnings multiples have worsened share market valuations. The recent fall in share markets has seen some improvement, but the gap between earnings yields and bond yields (which is a proxy for shares’ risk premium) is still around its lowest since 2011 in Australia and 2002 in the US. This still leaves shares vulnerable to bad news.
Equity risk premium over bonds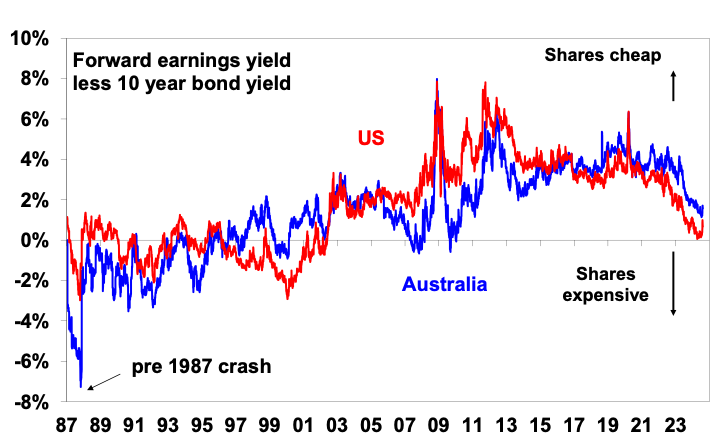
Source: Reuters, AMP
Chart 7 – the US dollar
Due to the relatively low exposure of the US economy to cyclical sectors (like manufacturing) and the high use of US dollar denominated debt, the $US is a “risk-off” currency. It tends to go up when there are worries about global growth and down when the outlook brightens. So, moves in it bear close watching as a key bellwether of the investment cycle. 2022 saw a surge in the $US with safe haven demand in the face of worries about recession, war and aggressive Fed tightening. Since its high it has fallen which is a positive sign – but the decline has stalled at a high level suggesting a degree of caution. A further downtrend in the $US would be a positive sign for investment markets. So far though it looks stuck, which partly explains the softness in the $A which is a cyclical currency.
The $A and the $US v major currencies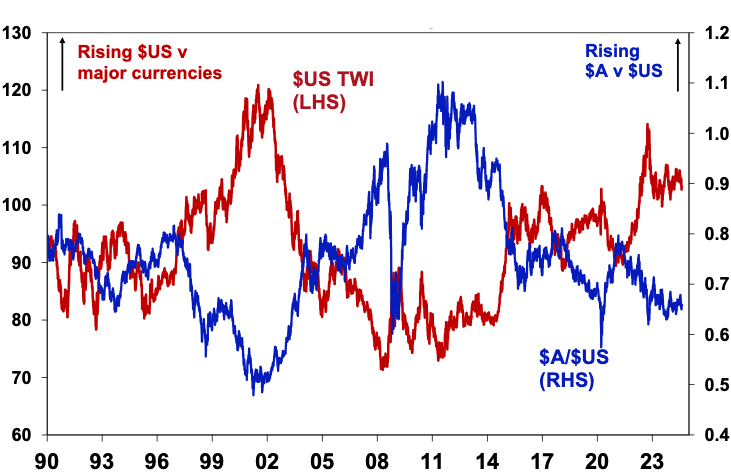
Source: Bloomberg, AMP
Dr Shane Oliver – Head of Investment Strategy and Chief Economist, AMP
Source: AMP Capital August 2024
Important note: While every care has been taken in the preparation of this document, AMP Capital Investors Limited (ABN 59 001 777 591, AFSL 232497) and AMP Capital Funds Management Limited (ABN 15 159 557 721, AFSL 426455) make no representations or warranties as to the accuracy or completeness of any statement in it including, without limitation, any forecasts. Past performance is not a reliable indicator of future performance. This document has been prepared for the purpose of providing general information, without taking account of any particular investor’s objectives, financial situation or needs. An investor should, before making any investment decisions, consider the appropriateness of the information in this document, and seek professional advice, having regard to the investor’s objectives, financial situation and needs. This document is solely for the use of the party to whom it is provided.


