Since its 2011 high, the Australian dollar has fallen 34% in value against the US dollar. For some time our view has been that it will fall to $US0.70 by year end with probably an overshoot into the $US0.60s. However, as we all know forecasting precise currency levels is a mug’s game. The key is that the direction remains down and we are likely to see a classic overshoot. This note looks at why and what it means for investors.
Drivers of the lower $A
There are essentially three drivers of the falling $A.
First the US dollar is undergoing a longer term upswing. After falling through much of last decade, from 2008 it started tracing out a broad bottom and now looks to have commenced a rising trend. This is supported by relative strength in the US economy pointing to the Fed being closer to monetary tightening in contrast to Europe, Japan and China which are continuing to ease monetary conditions and at the same time that much of the emerging world is beset by various structural problems. While the rate of increase in the $US has slowed from the pace seen last year – particularly as the Fed will allow for the dampening impact on the US economy when considering interest rate hikes – the trend is likely to remain up.
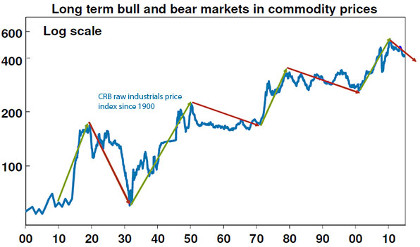
Second, commodity prices are now in a long term, or secular downswing. Their secular upswing that ran through last decade is now in reverse thanks to a combination of:
-
Surging supply and slower demand. Last decade demand for industrial commodities was surging led by industrialisation in China and strong demand growth in other emerging countries as supply (after years of commodity weakness) struggled to catch up. Now it’s the other way around as demand growth in China has slowed, many emerging markets are weak and supply is surging after record investment in resources for everything from coal and iron ore to gas. The surge in iron ore supply is well known. Over the last 12 months global oil production rose by 3.1 million barrels per day but consumption rose by just 1.4 mbd.
-
The rising value of the $US. Since commodities are priced in US dollars they move inverse to it. They rose last decade when the $US was in decline and are now heading down as he $US is on the way up.
Gold is also caught up in this as its part of the commodity complex. But each commodity has its own specific factors. It seems like only yesterday that gold bugs dreamt of quantitative easing causing a crash in the $US and hyperinflation, central banks were reportedly piling into gold for their reserves and the gold price was supposedly on its way to infinity and beyond. Well as it turned out the $US didn’t crash, hyperinflation never arrived and when it comes to central banks and gold the best thing to do is the opposite to what they are doing (just as it was when they were dumping gold 15 years or so ago!). And so the gold price has plunged more than 40% from its 2011 high to a five year low. While there will be bounces with gold being part of the commodity complex which is in a secular downtrend I find it hard to be optimistic on gold for the next few years.
As can be seen in the next chart raw material prices trace out roughly 10 year long term upswings followed by 10 to 20 year long term bear markets. After an upswing last decade, they now look to have embarked on a secular downtrend.

Source: Global Financial Data, Bloomberg, AMP Capital
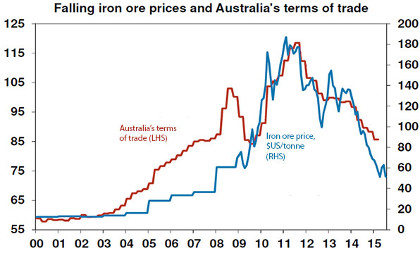
This is bad news for Australia as plunging prices for commodities have resulted in a collapse in export prices and hence our terms of trade. This is highlighted by the iron ore price which at the start of last decade was below $US20/tonne rising to over $US180/tonne in 2011 and is now running around $US51/tonne.

Source: Bloomberg, AMP Capital
Finally, the relative performance of the Australian economy has deteriorated and this is seeing the interest rate differential in favour of the $A decline, making it relatively less attractive to park money in Australia as part of the so-called “carry trade”. The Fed has ended quantitative easing and is getting closer to monetary tightening whereas there is a 50% chance the RBA will ease rates again – particularly with the business investment outlook remaining bleak, signs emerging that APRA’s efforts to cool property investment are biting and inflation remaining benign. More broadly, perceptions of global investors about the Australian economy are becoming less favourable. Over much of the last decade it was positive reflecting Australia’s favourable fundamentals tied to growth in the emerging world and through the Eurozone crisis as an AAA rated safe haven. Now there is a bit more wariness as emerging country growth has slowed, the commodity cycle has gone from a tailwind to a headwind for the Australian economy and Australia has struggled to get its budget deficit back under control.
Big picture for the $A not flash
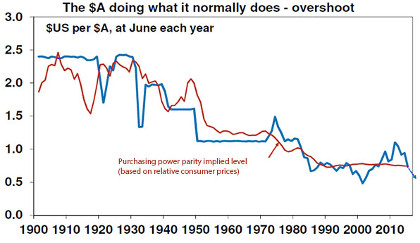
Against this backdrop, the big picture outlook for the $A is poor. Perhaps one way to see this is via what is called purchasing power parity (PPP), according to which exchange rates should equilibrate the price of a basket of goods and services across countries. In other words, the exchange rate should be at the level that would make a country’s competitiveness neutral internationally. If the exchange rate is above this level then the country would be uncompetitive internationally and vice versa if it is below. A guide to this is in the next chart which shows the $A/$US rate against where it would be if the rate had moved to equilibrate relative consumer price levels between the US and Australia since 1900.

Source: RBA, ABS, AMP Capital
Right now the $A at around $US0.73 has just fallen below fair value on this measure of around $US0.75. But it can be seen from the chart that the $A rarely stays at the purchasing power parity level for long and long periods of overvaluation are followed by long periods of undervaluation. A driver of this in recent decades has been commodity prices and the relative performance of the Australian economy. These were positive last decade and so over the 2001 to 2011 period the $A went from well below PPP at $US0.48 to well above at $US1.10. Now the reverse is underway. Given the damage done to Australian industry through the boom years as Australia’s international competitiveness collapsed into early this decade as the $A surged, a period well below the purchasing power parity level now looks likely in order to reinvigorate Australian businesses again. In other words, this is necessary to make up for the damage done by the high $A. This is likely to take the $A into the $US0.60s but it could easily go lower.
In the very short term, the Australian dollar has fallen a bit too fast and it seems everyone is bearish about the Aussie again (with economists seemingly falling over themselves to revise their $A forecasts lower), so a short term bounce could well emerge. However, for the reasons noted above the broad trend in the $A is likely to remain down. I remain of the view that it will fall to around $US0.70 by year end and then move even lower.
Of course, it’s worth noting that the fall in the $A on a trade weighted basis won’t be as pronounced as against the $US, as the Yen and Euro are also likely to remain soft against the $US.
Implications for investors
There are a several implications for investors.
First, and most significantly, the ongoing decline in the value of the Australian dollar highlights the case for Australian based investors to maintain a relatively greater exposure to offshore assets that are not hedged back to Australian dollars (ie remain exposed to foreign currencies) than was the case say a decade ago when the $A was in a strong rising trend. Put simply, a declining $A boosts the value of an investment in offshore assets denominated in foreign currency one for one. For example, a 10% fall in the value of the $A will boost a foreign share portfolio by 10% in value in Australian dollar terms. This has been seen over the last few years – the fall in the value of the $A over the 12 months to June turned an 8.5% return from global shares measured in local currencies into a 25.2% return for Australian investors when measured in Australian dollars.
Second, having an exposure in foreign currency (notably the $US) provides a hedge for Australian based investors should the global economic outlook deteriorate. Recent global economic data – eg, slowing OECD leading economic indicators, stalling world trade growth and soft Chinese business surveys – have led to renewed concerns regarding the global growth outlook. In our view this is likely to be just another growth scare, of which we have seen a few over the last few years. But if we are wrong then being short the $A and more exposed to foreign currency provides a bit of protection as the $A invariably falls (and foreign currencies rise) in response to weaker global growth.
Finally, the fall in the value of the $A taking it down to levels that more than offset Australia’s relatively high cost levels is very positive for sectors that compete internationally including manufacturing, tourism, higher education, agriculture & miners. This in turn should help the economy weather the mining downturn and is in turn positive for the Australian share market. Roughly speaking each 10% fall in the value of the $A boosts company earnings by 3%. That said in the current environment, Australian shares are likely to remain a relative underperformer in terms of total returns compared to global shares.
About the Author
Dr Shane Oliver, Head of Investment Strategy and Economics and Chief Economist at AMP Capital is responsible for AMP Capital’s diversified investment funds. He also provides economic forecasts and analysis of key variables and issues affecting, or likely to affect, all asset markets.
Important note: While every care has been taken in the preparation of this article, AMP Capital Investors Limited (ABN 59 001 777 591, AFSL 232497) and AMP Capital Funds Management Limited (ABN 15 159 557 721, AFSL 426455) makes no representations or warranties as to the accuracy or completeness of any statement in it including, without limitation, any forecasts. Past performance is not a reliable indicator of future performance. This article has been prepared for the purpose of providing general information, without taking account of any particular investor’s objectives, financial situation or needs. An investor should, before making any investment decisions, consider the appropriateness of the information in this article, and seek professional advice, having regard to the investor’s objectives, financial situation and needs. This article is solely for the use of the party to whom it is provided.


